Analytics Dashboard
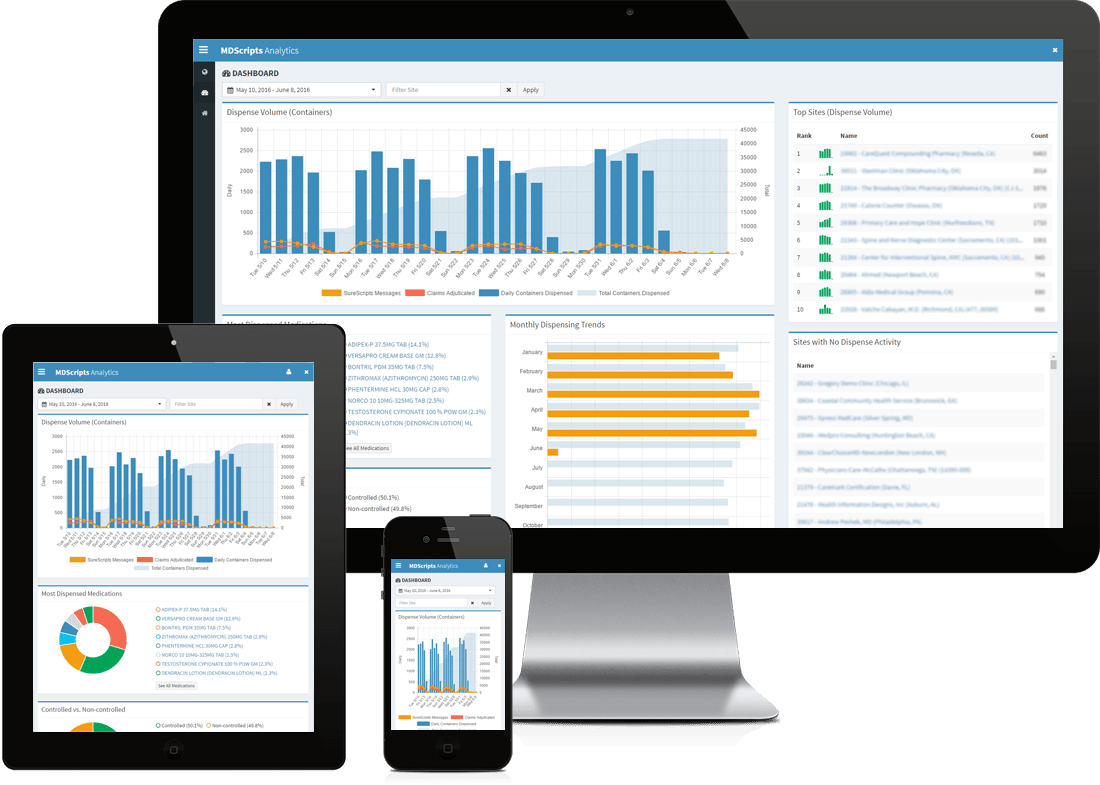
MDScripts Real Time Analytics Dashboard
Our real-time analytics dashboard gives you instant visual insight into key metrics to help you better manage your organization or practice.

Role-based reporting
Role-based reporting controls the level of data users have access to within the analytics dashboard. Standard users only see data for a single site, while administrators have access to data across their entire organization or within custom groups of sites.
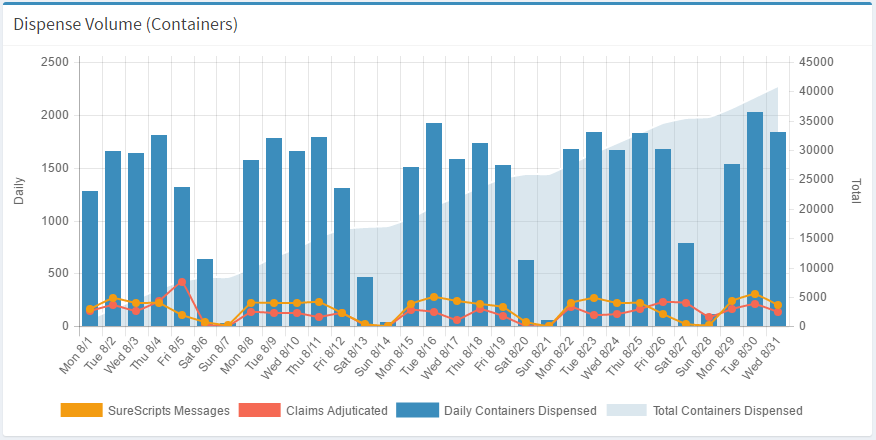
Visualize dispensing trends
Quickly analyze key metrics over any period of time. See year-to-date, year-over-year and month-over-month dispense volume to evaluate performance and determine anomalies. Perform analysis at the organization, site or provider level.
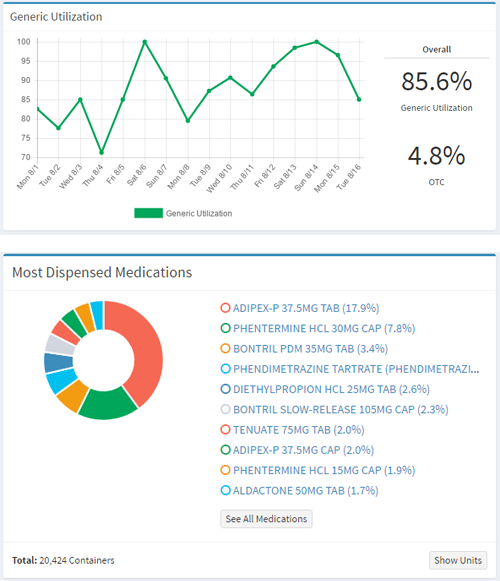
Better understand your business
Our analytics dashboard allows you to see important metrics about the medications you are dispensing. These metrics include a breakdown of generic versus brand utilization as well as most-dispensed medications and controlled versus non-controlled substances.
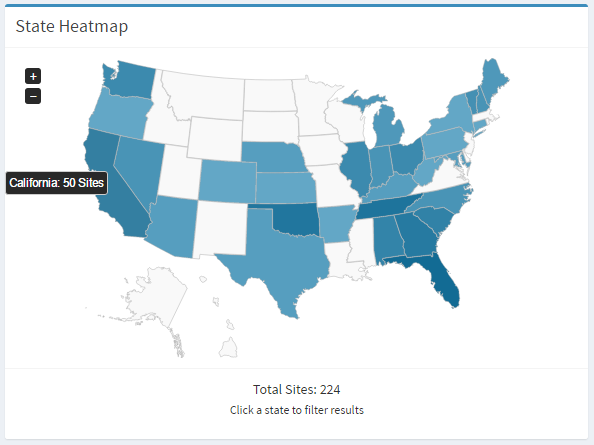
Geographical based reporting
For organizations with sites across multiple states, the dashboard shows a graphical 'heat map' of site locations and allows you to quickly drill down and view analytics by state.